Operation and Maintenance Monitoring Guide Manual
Overview
Version
| Software Name | Version | Description |
|---|---|---|
| chinlink-edi-core.jar | 25.1.1164.423 | ChinLink Core Library |
| chinlink-edi-ultron.jar | 25.1.1164.1181 | ChinLink Data Integration Platform |
Application Scenarios
This document presents existing operation and maintenance monitoring function solutions for common operation and maintenance monitoring requirements, helping customers quickly implement the monitoring of the ChinLink Data Integration Platform.
The solutions are applicable to the ChinLink Data Integration Platform that has been deployed and will elaborate on the daily maintenance, management, and monitoring methods of the ChinLink Data Integration Platform.
Feature Introduction
The ChinLink Data Integration Platform has certain configuration requirements for the system. If the configuration does not meet the requirements, there may be risks such as abnormal use and downtime. Therefore, it is necessary to regularly check the environment and application configurations to ensure the healthy operation of the application.
At the same time, administrators need to pay attention to the running status of the application, promptly avoid risks through operation and maintenance means, or locate and eliminate problems after they occur to achieve the continuous high availability of the application.
Main Configuration Files and Descriptions
This chapter mainly introduces the information and detailed descriptions of the main configuration files in the ChinLink Data Integration Platform.
Location of the Main Configuration File
${CHINLINK_HOME}/application.yamlFile Content
Configure the main contents of the system, including the database, ports, logs, etc.
Key Information in the File
The relationship between common configuration keywords and their contents in the application.yaml file is as follows.
| Keyword | Description |
|---|---|
| spring.datasource.url | Database connection address |
| spring.datasource.username | Database username |
| spring.datasource.password | Database password |
| server.address | Server address |
| server.port | Server port |
System Inspection
It is recommended that administrators conduct regular inspections of the system to ensure that the environment where the application is located and the application configurations are reasonable to guarantee the normal operation of the application.
The inspection content includes port checks, network service checks, storage service checks, environment configuration checks, and business configuration checks.
Port Check
During the normal use of the ChinLink Data Integration Platform, some ports on the server need to be opened. Therefore, it is necessary to check whether these ports are open to avoid abnormal system functions.
| Category | Port | Description |
|---|---|---|
| Ultron Port | Default 8480 | Port of the ChinLink Data Integration Platform |
| AS2 Port | User-specified | AS2 service port |
| SFTP Port | User-specified | SFTP service port |
| OFTP2 Port | User-specified | OFTP2 service port |
| HTTP Port | User-specified | HTTP service port |
Network Service Check
Use the telnet command to check if the port is open.
telnet 127.0.0.1 8480Use the tracert command to check the routing and packet loss conditions
tracert 127.0.0.1Network Monitoring Software
You can use Uptime Kuma as a port monitoring server to monitor whether the port is normal. For the specific installation and usage methods of Uptime Kuma, please refer to the official website.
Storage Service Check
Disk Performance Check
Reason for Check:
Disk read performance and disk write performance will affect the business of the ChinLink Data Integration Platform. Therefore, it is necessary to pay attention to the performance and usage of the disk.
If the system uses high-frequency and large-file message services, there are certain requirements for the read and write performance of the disk. It is recommended that the disk write speed should be above 100M/s; otherwise, it may affect the normal operation of the business.
Check Method
Windows System
Performance Monitor
- Press
Win + Rto open the Run window, enterperfmon.msc, and press Enter. - In the left navigation bar, expand “Performance Monitor”, and then select “Add Counters”.
- In the “Add Counters” window, find disk-related counters, such as:
- PhysicalDisk% Disk Time (Disk Usage)
- LogicalDisk\Average Disk Queue Length (Disk Queue Length)
- LogicalDisk\Read Bytes/sec (Read Speed)
- LogicalDisk\Write Bytes/sec (Write Speed)
- Select the required counters, click “Add”, and then click “OK”.
- The system will display real-time disk read and write performance data.
Resource Monitor
- Press
Ctrl + Shift + Escto open the Task Manager. - Switch to the “Performance” tab and click “Open Resource Monitor” at the bottom.
- In the Resource Monitor, switch to the “Disk” tab to view information such as disk read and write speeds and active processes.
Linux System
iostat Command
Install iostat
If the iostat command is not installed in the system, it can be installed using the following commands:
- For Debian/Ubuntu-based systems:
sudo apt update
sudo apt install sysstat- For CentOS/RHEL-based systems:
sudo yum install sysstat- For Fedora-based systems:
sudo dnf install sysstat- After installation, ensure that the
sysstatservice is enabled to collect data:
sudo systemctl enable sysstat
sudo systemctl start sysstat
Query Disk Read Load Conditions
iostat -xmThis command displays detailed disk read load conditions in MB. Pay special attention to the following four parameters:
- w_await: Average waiting time for each write I/O operation
- r_await: Average waiting time for each read I/O operation
- %util: The percentage of time used for I/O operations per second, i.e., the CPU percentage consumed by I/O
- %iowait: The percentage of time the CPU waits for input and output operations to complete
The higher the values of w_await and r_await, the longer the waiting time for writing and reading.
The higher the values of %util and %iowait, the higher the disk utilization of the current system, and the CPU is mostly in a waiting state for I/O. This usually indicates that the I/O has encountered a bottleneck. In this case, it is recommended to improve disk performance.
Disk Remaining Space Check
Reason for Check
As the ChinLink Data Integration Platform runs, more and more logs, backups, cache files, etc., will be generated, gradually increasing the occupation of disk space. If the remaining disk space is not monitored, there may be insufficient disk space, which can affect the system's operation and even cause downtime.
Administrators need to pay attention to the remaining space of the disks where the db update directory, data directory, backup directory, and logs directory are located. If the remaining space on these disks is small, it is recommended to clean up the disk or expand its capacity to ensure sufficient space for the normal operation of the ChinLink Data Integration Platform.
Regularly clean up expired or invalid content in the ChinLink Data Integration Platform to maintain healthy disk space.
Check Method
Use disk tools to check the remaining space.
Memory Configuration Check
Recommended Values
| Frequency (Messages/Day) | Concurrency (Messages/Minute) | Recommended Configuration | Minimum Configuration |
|---|---|---|---|
| 1 - 1000 | 1 - 100 | Single Server: CPU: 4 cores, 2 GHz Memory: 4 GB | Single Server: CPU: 2 cores, 2 GHz Memory: 2 GB |
| 1000 - 10000 | 1 - 100 | Single Server: CPU: 8 cores, 2 GHz Memory: 16 GB | Single Server: CPU: 4 cores, 2 GHz Memory: 8 GB |
| 1000 - 10000 | 100 - 1000 | Dual Nodes: CPU: 8 cores, 2 GHz Memory: 16 GB | Single Server: CPU: 4 cores, 2 GHz Memory: 8 GB |
JRE Version
It is recommended to use JRE 17-LTS or later.
Basic Maintenance
During the normal daily operation of the application, maintenance tasks are relatively simple. When necessary, administrators can view the application's running logs or check if there are any exceptions in the application's various monitoring indicators.
Log Viewing
The following are several types of logs for the ChinLink Data Integration Platform:
| Log Type | Storage Location | Description |
|---|---|---|
| System Log | ${CHINLINK_HOME}/data/logs | System log, records various information during system operation, such as startup, shutdown, exceptions, etc. |
| AS2 Business Log | ${CHINLINK_HOME}/data/projects/<database_id>/<project_id>/daemons/as2-daemon/logs | AS2 business log, records various information during AS2 business operation, such as receiving, sending, exceptions, etc. |
| OFTP2 Business Log | ${CHINLINK_HOME}/data/projects/<database_id>/<project_id>/daemons/oftp2-daemon/logs | OFTP2 business log, records various information during OFTP2 business operation, such as receiving, sending, exceptions, etc. |
| SFTP Business Log | ${CHINLINK_HOME}/data/projects/<database_id>/<project_id>/daemons/sftp-daemon/logs | SFTP business log, records various information during SFTP business operation, such as receiving, sending, exceptions, etc. |
| HTTP Business Log | ${CHINLINK_HOME}/data/projects/<database_id>/<project_id>/daemons/http-daemon/logs | HTTP business log, records various information during HTTP business operation, such as receiving, sending, exceptions, etc. |
| Operation Log | ${CHINLINK_HOME}/data/projects/<database_id>/<project_id>/daemons/tasks/<group_id>/<task_id>/logs | Operation log, records various information during operation execution, such as receiving, sending, exceptions, etc. |
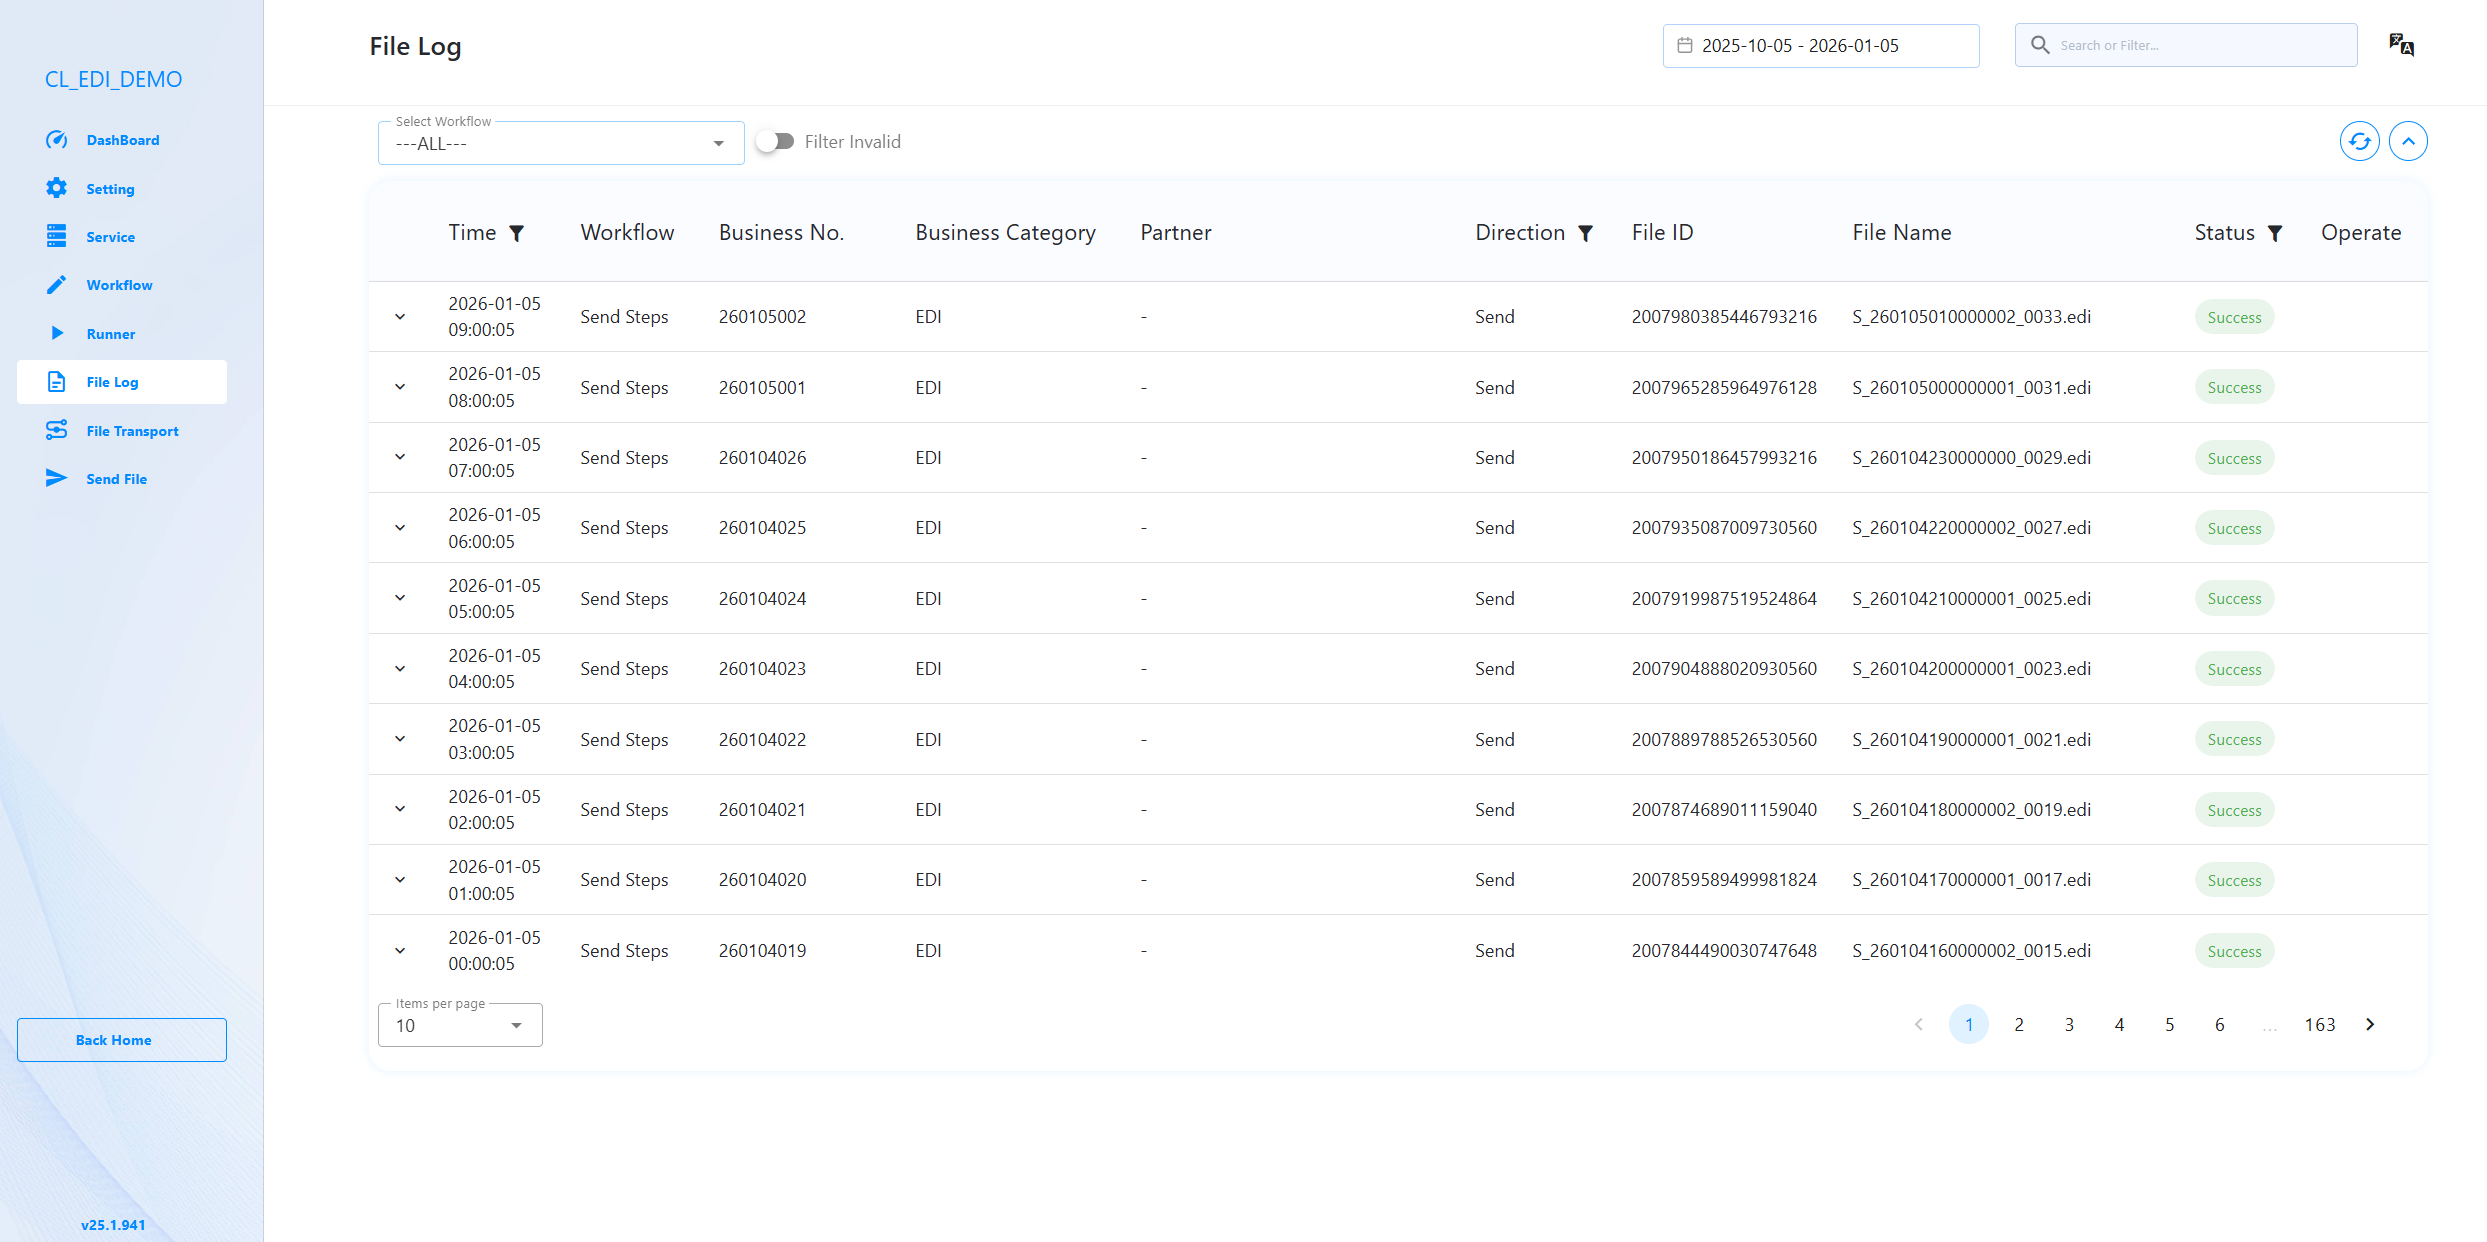
Quick Operation and Maintenance via the ChinLink Data Integration Platform
Use the log viewing page to view current logs.
Monitoring Indicators
Indicator Descriptions
Operation and maintenance personnel mainly need to pay attention to whether the following indicators are abnormal:
| Indicator | Monitoring Content |
|---|---|
| Memory | Check the server's memory usage through the command line or visualization tools. Check if the memory usage is too high (80% or above). |
| CPU | Check the server's CPU usage through the command line or visualization tools. Check if the CPU usage is too high (80% or above). |
| Disk Space | Check the disk free space of the disk directory where the ChinLink Data Integration Platform is located through the command line or visualization tools. Check if the remaining disk space is too small (less than 10 GB). |
| Network | Check the server's network status through the command line or visualization tools. Check if there is network latency (latency greater than 100 ms). |
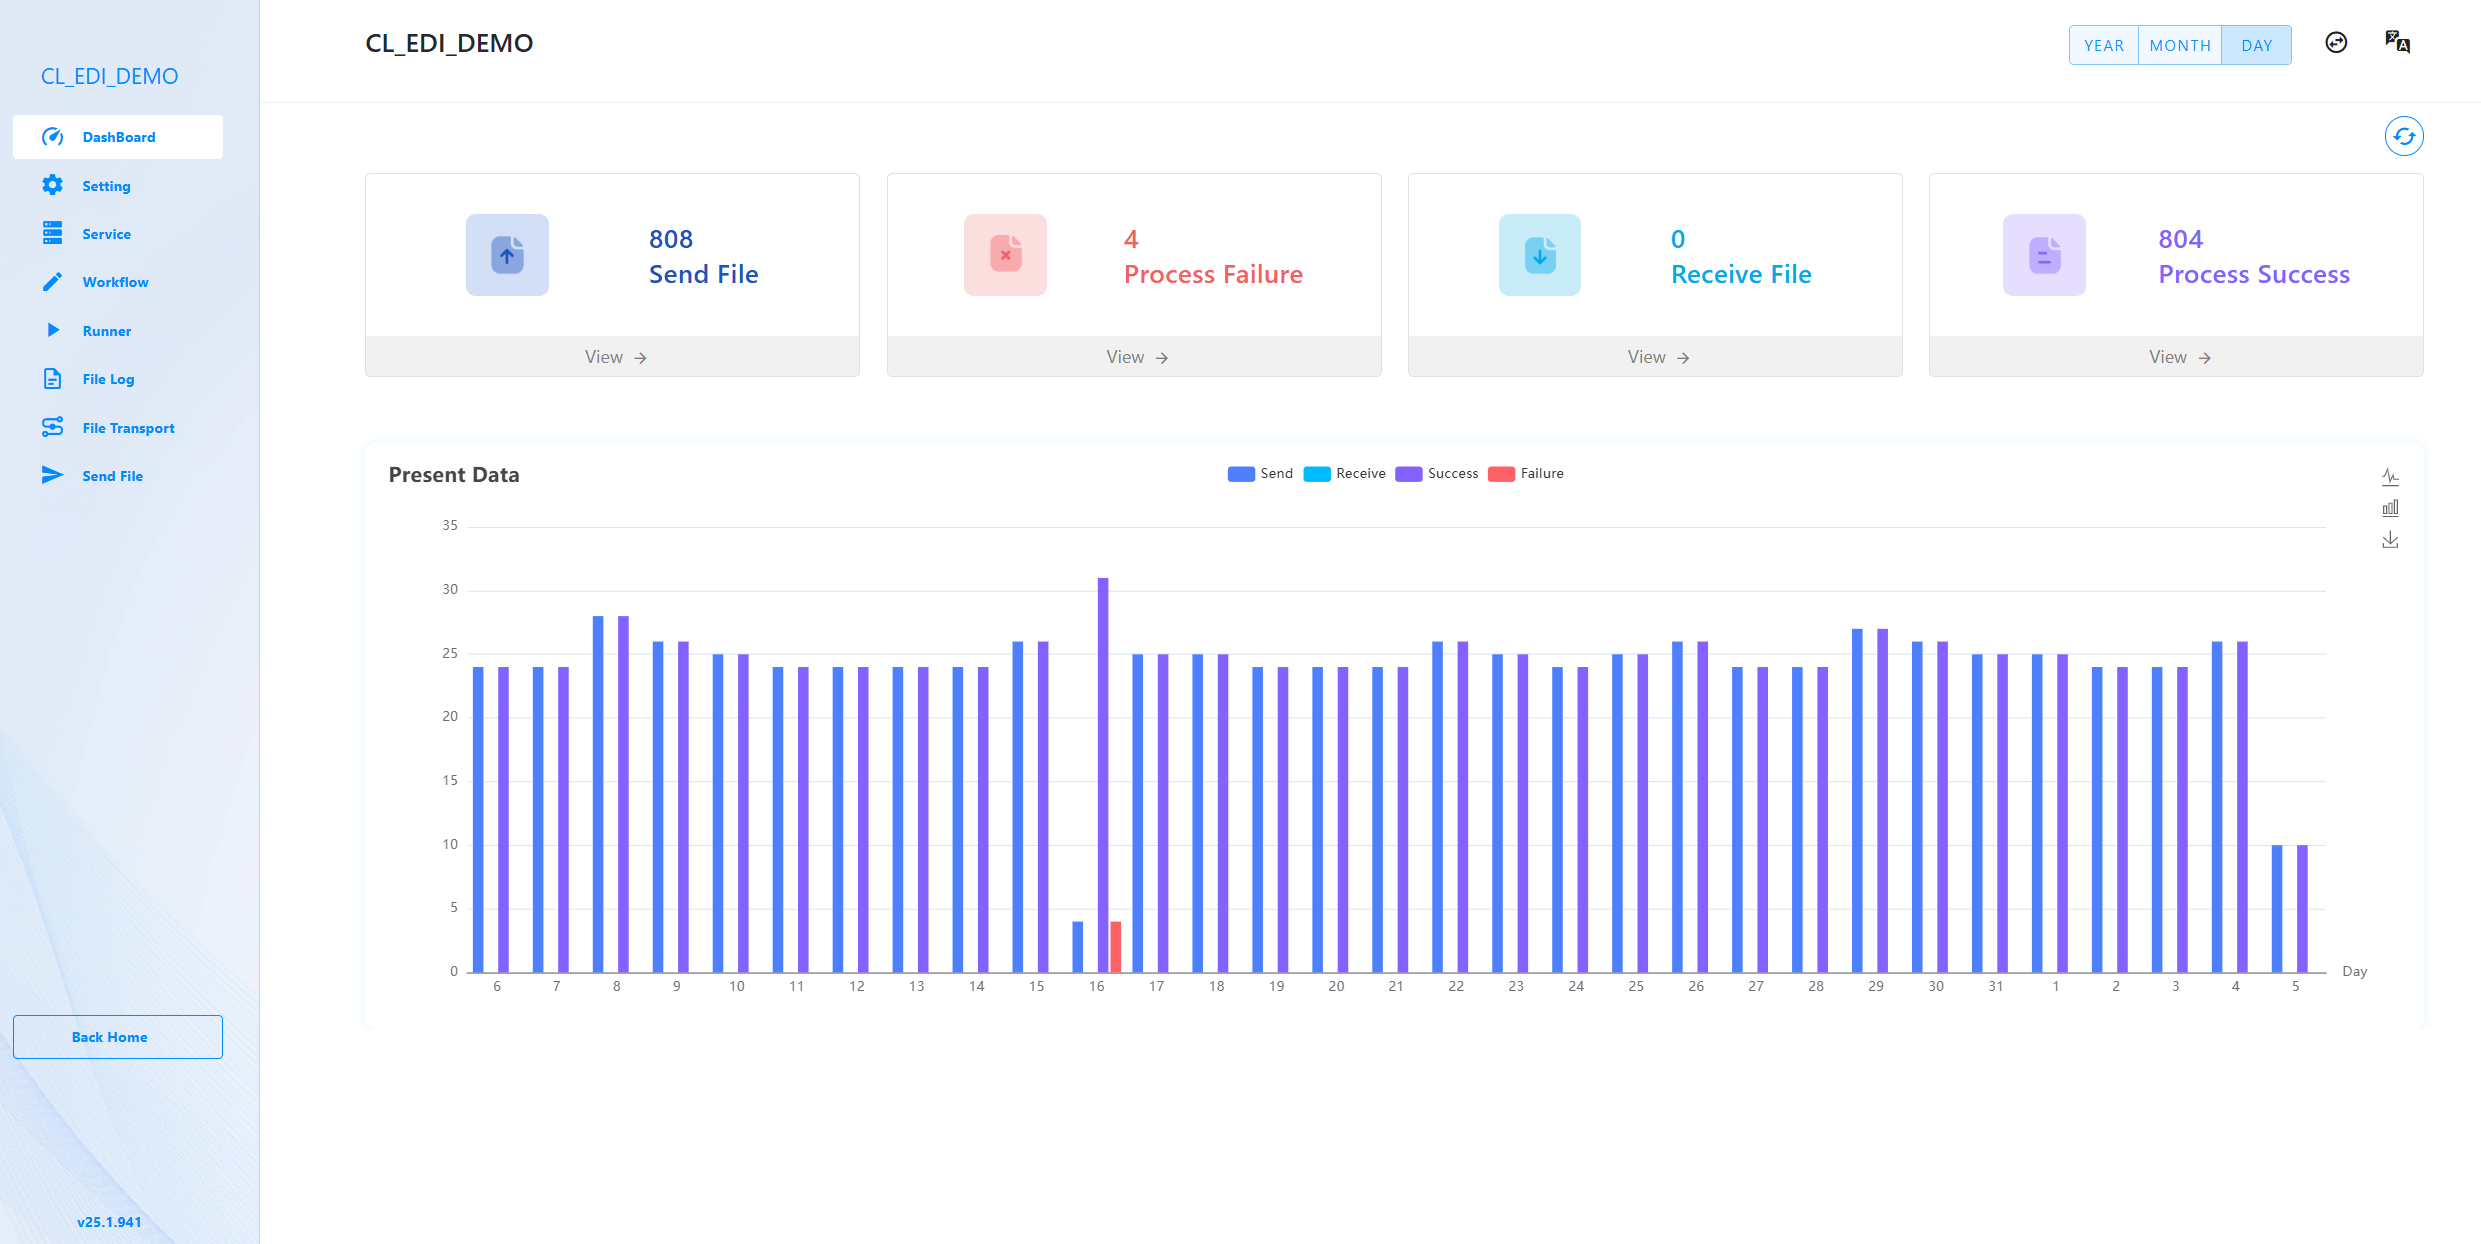
| Message Status | Monitor the running status of messages through the ChinLink Data Integration Platform. |
Monitoring Information
Monitor the running status of messages through the ChinLink Data Integration Platform.
Monitor network connectivity using Uptime Kuma software.

Exception Maintenance
Exception Alerts
To promptly detect exceptions in the ChinLink Data Integration Platform, it is necessary to implement monitoring and alerting for various platform indicators. The following are some recommended implementation schemes:
If a cloud server (such as Alibaba Cloud, Huawei Cloud, etc.) is used, you can use the monitoring cloud services provided by the cloud service provider to monitor server resource exceptions.
Notify operation and maintenance personnel when the server encounters exceptions.
Administrators can log in to the ChinLink Data Integration Platform and configure an email service for runtime exceptions to send reminders to operation and maintenance personnel.
Downtime Handling
When an application encounters an exception, downtime may occur. To ensure business availability, it is necessary to quickly restore the application. At the same time, try to save the logs at the time of downtime to facilitate the localization of downtime causes and risk elimination, preventing similar exceptions from occurring again. For downtime scenarios, perform the following operation and maintenance tasks:
Ensure that the JDK tools are available in the system environment. When the application goes down, promptly export dump files:
- First, find the Process ID (PID) of the Java process:bash
jps -l - Then, use
jmapto generate a heap dump file:bashjmap -dump:format=b,file=/path/to/dumpfile.hprof <pid>
- First, find the Process ID (PID) of the Java process:
After downtime occurs, analyze the downtime cause through the dump file yourself or contact technical support for assistance, and quickly eliminate downtime risks.
For downtime scenarios, administrators can log in to the ChinLink Data Integration Platform and configure the server to start automatically, ensuring that services automatically run after a restart.
Backup and Upgrade
Backup and Restoration
The ChinLink Data Integration Platform needs to be backed up regularly to ensure timely recovery in scenarios such as user misoperation and version rollback. The backup and restoration methods are as follows:
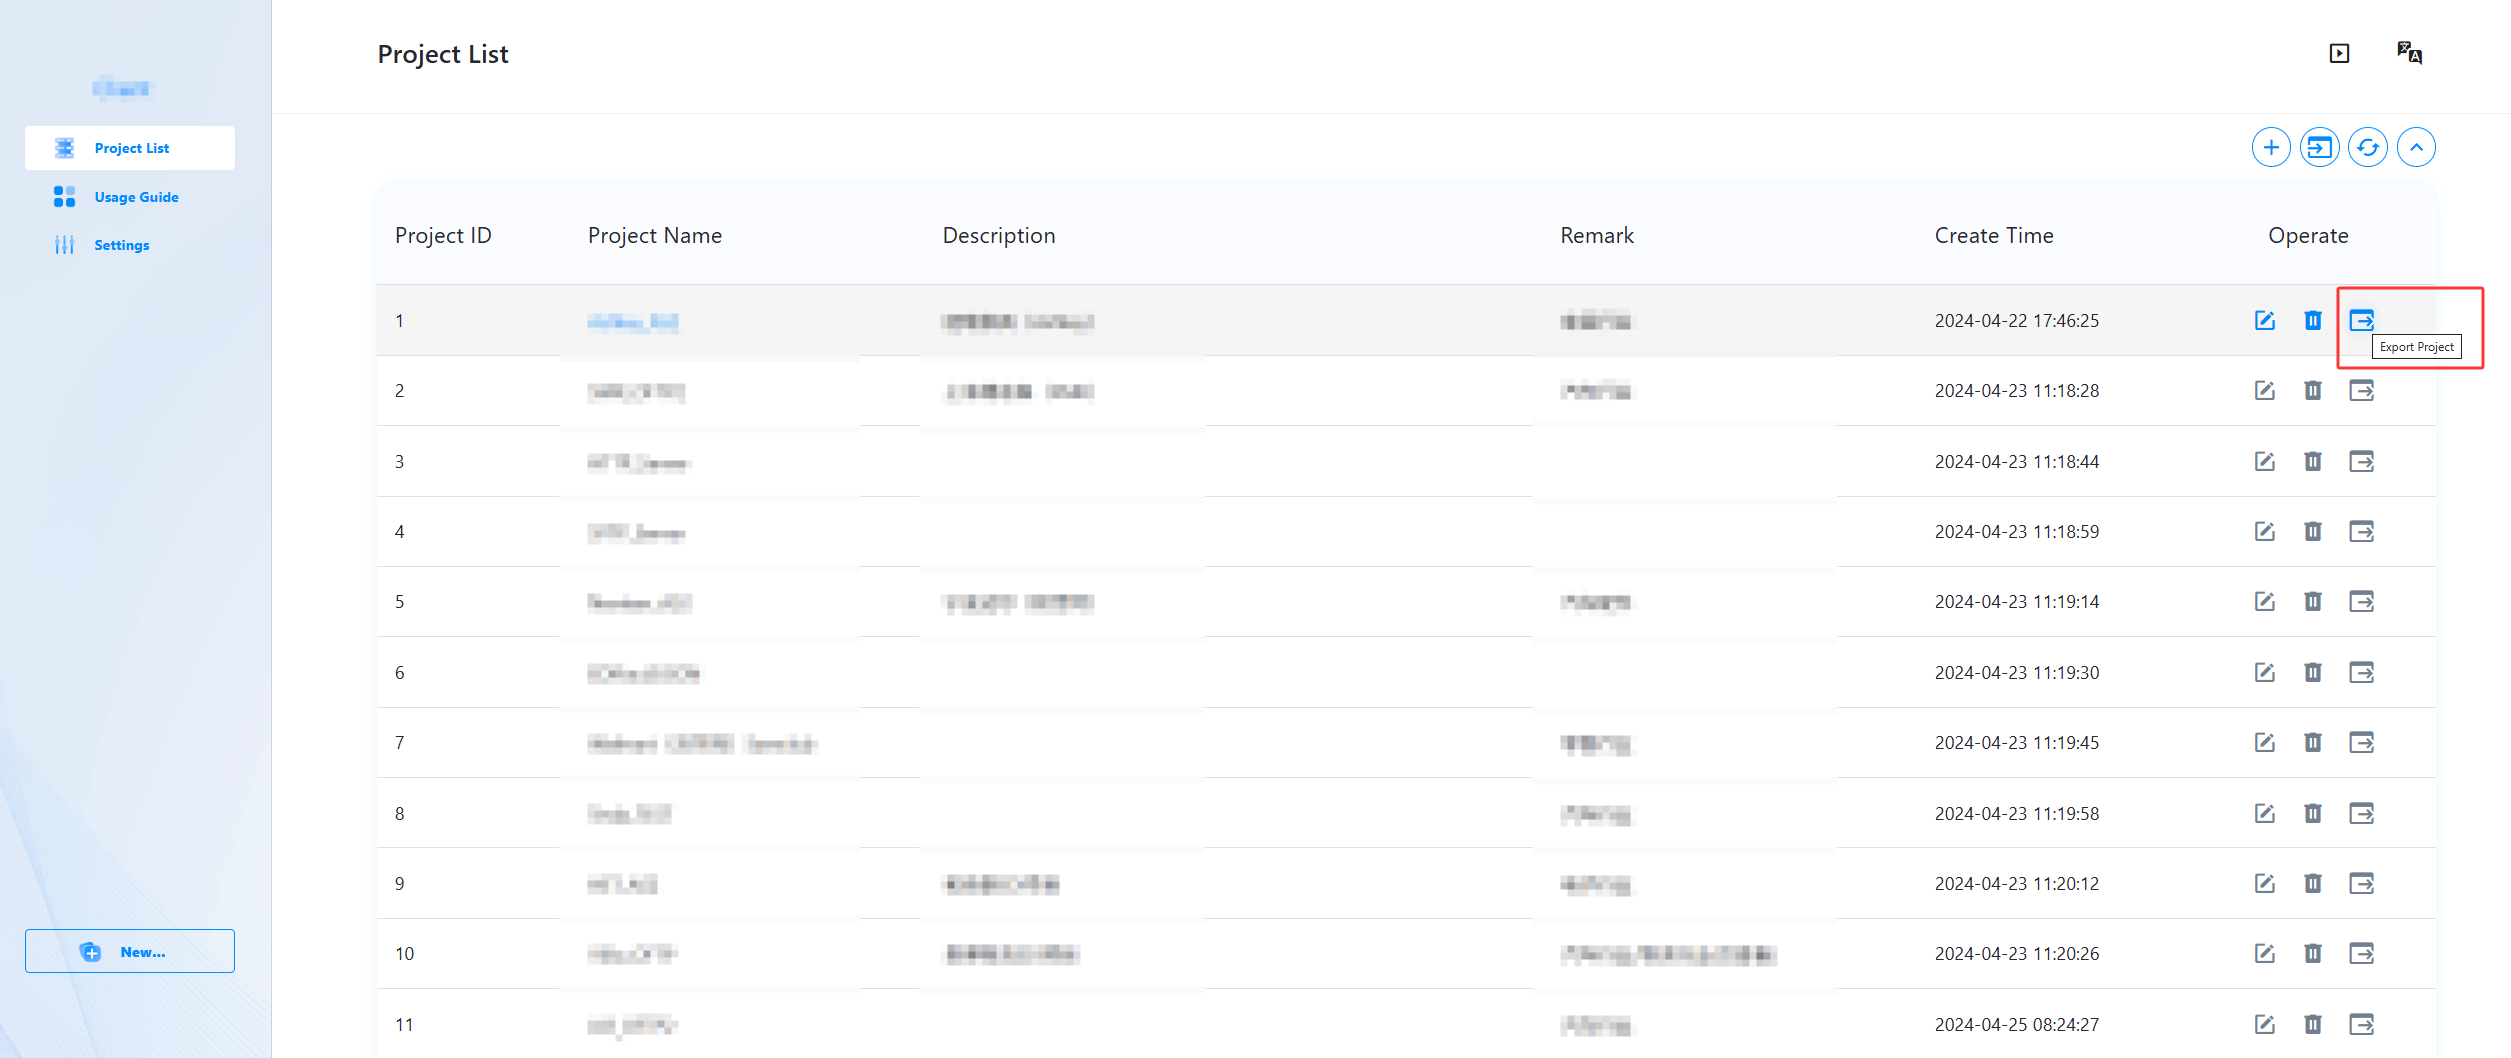
Use the export function to export project configuration files.
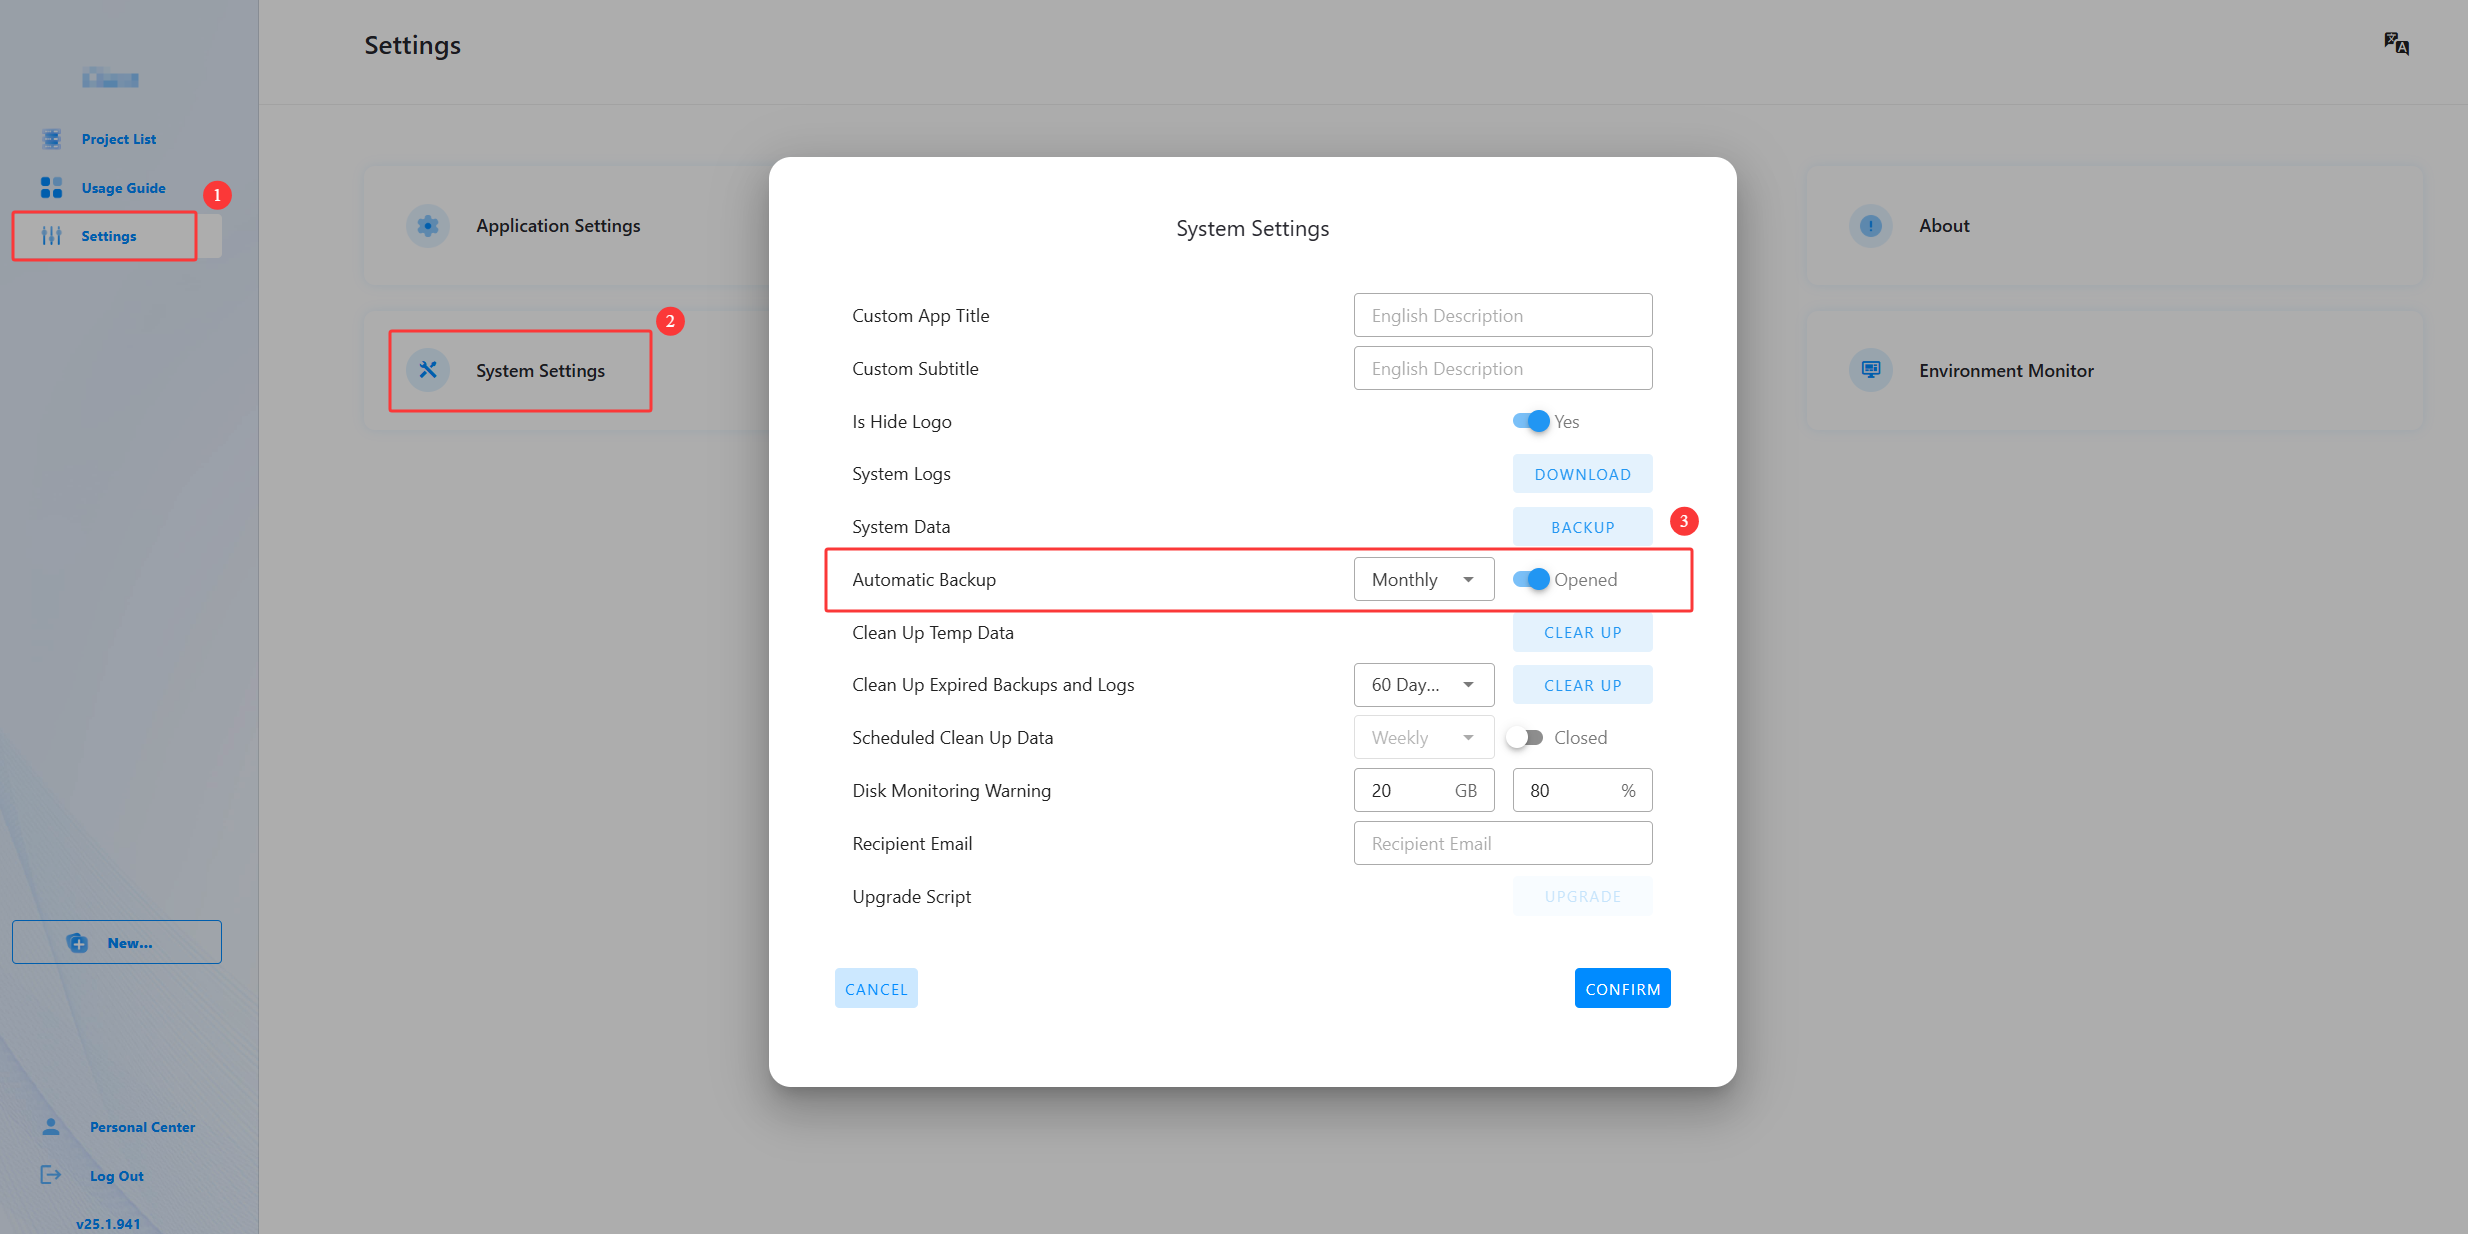
Use the automatic backup function to back up data.
Update and Upgrade
The ChinLink Data Integration Platform will continue to be iteratively updated, potentially adding new features or fixing issues in previous versions. To obtain a better functional experience, customers often need to upgrade the version. This chapter only introduces the minor version upgrade method. For major version upgrades, please contact ChinLink Data technicians for assistance. Before upgrading, ensure that a backup has been performed so that if any exceptions occur during or after the upgrade, the system can be quickly restored to an available state without incurring losses. The backup method can be referred to in the previous section.
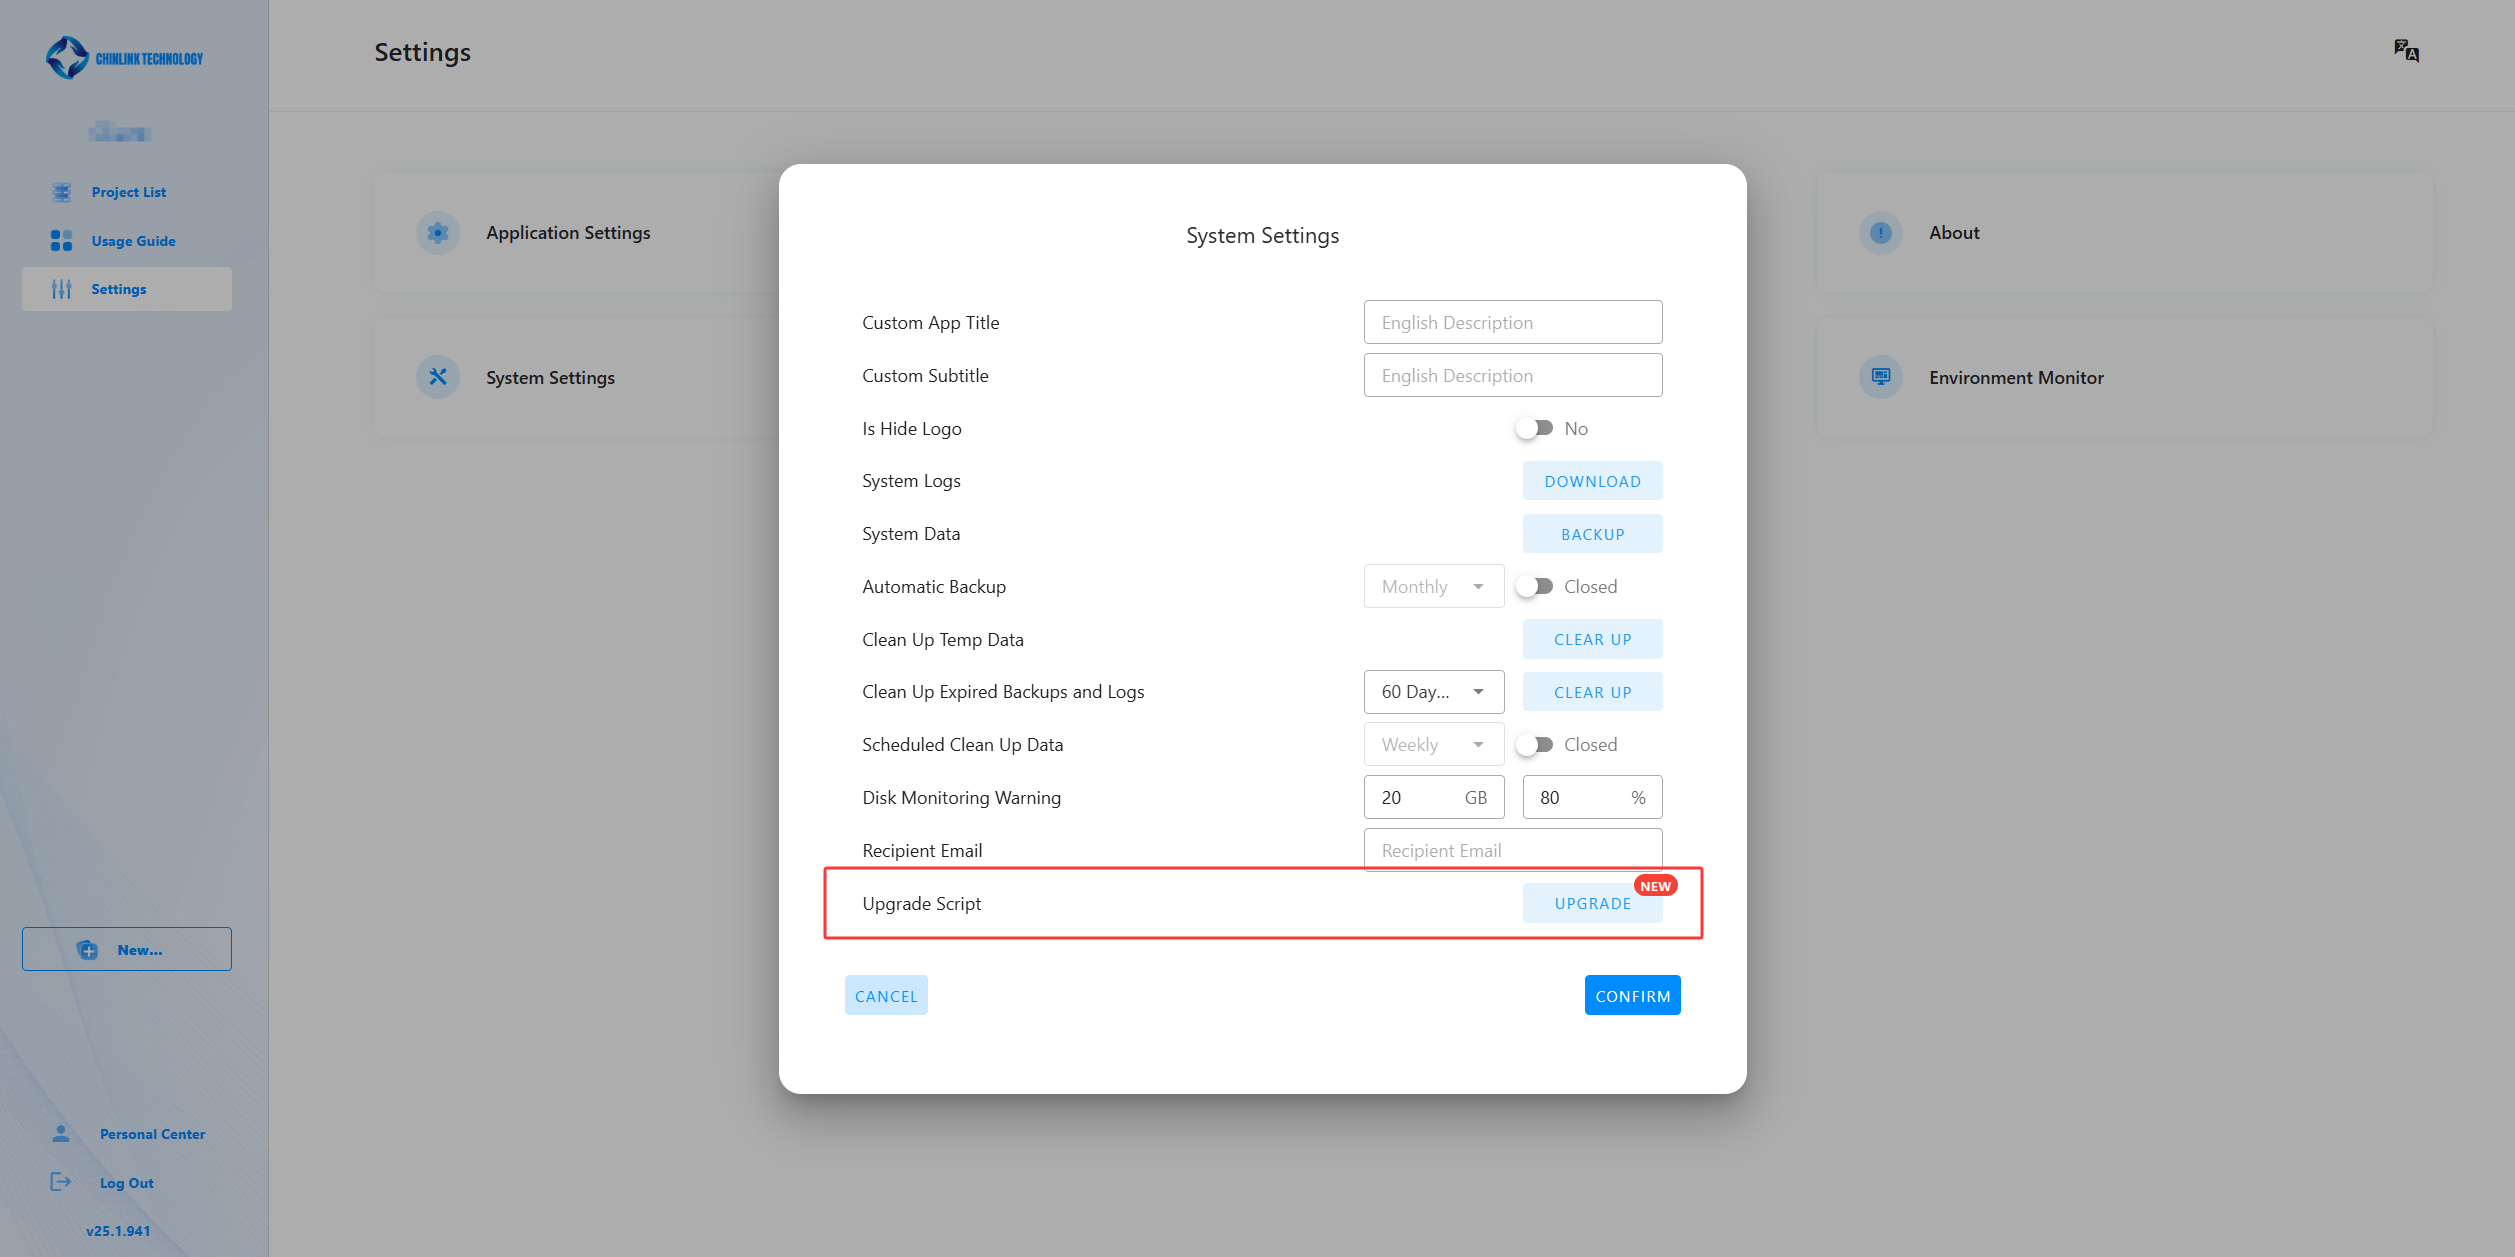
Manually update the installation package: Users can manually replace the JAR package after obtaining it. The operation methods are the same for Linux and Windows systems.
Replace the old package under the
${CHINLINK_HOME}/setup/directory on the server and restart the server.Click the “Upgrade” button in the new system to update the configuration files.